


Crypto charts can be a jungle—especially when you’re predicting price moves on PRDT in tight time frames. That’s where support and resistance lines come in: dead-simple tools to spot where prices might bounce or bust. They’re like guardrails for your trades—showing you when to jump in, cash out, or brace for a shift. Here’s how to draw them like a pro, step by step.
What Are Support and Resistance?
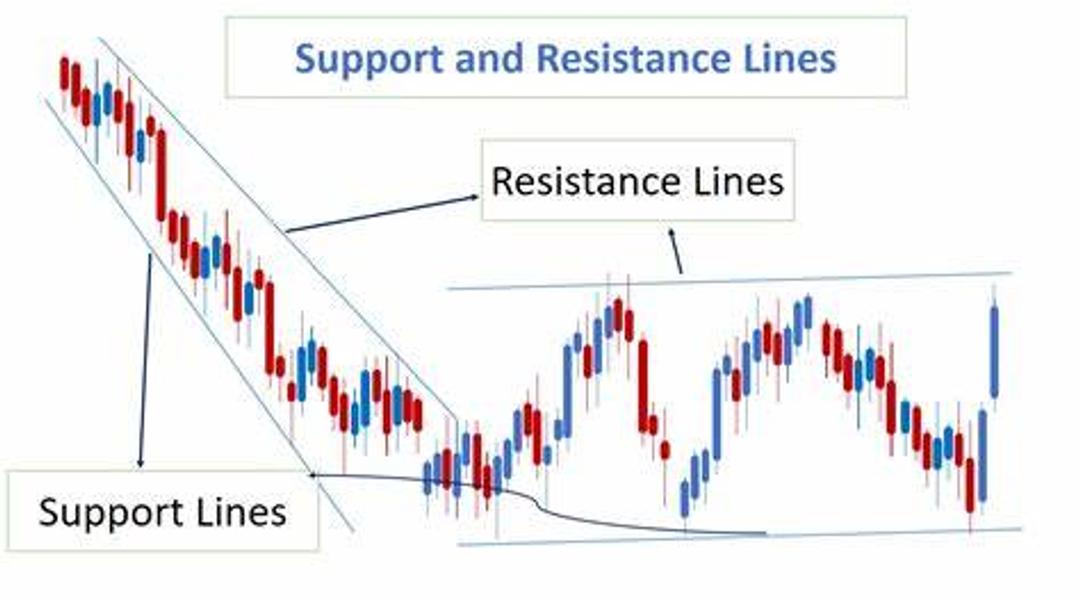
- Support: The price floor where crypto stops tanking and buyers swoop in. Think of it as the spot where the dip gets a bounce.
- Resistance: The price ceiling where the rally hits a wall and sellers take over. It’s where the climb stalls out.
These levels are your map to guess where the action’s headed—crucial for PRDT’s fast predictions.
Pick Your Chart
First, grab the right chart for your style. Day traders (or PRDT predictors) might rock a 5-minute or 15-minute chart—quick and snappy. Swing traders? Go daily or weekly. Match the timeframe to your vibe, or you’re just guessing in the dark.
Hunt Down Key Levels
To nail support and resistance, scan the chart for these clues:
- Multiple Touches: Look for prices the chart keeps hitting—lows that bounce or highs that reverse. The more touches, the tougher the level.
- Round Numbers: Crypto loves those clean digits—$100, $1,000, $10,000. Traders pile orders here, making them mental walls or floors.
- Past Action: Check history—old support or resistance zones often flex their muscle again.
Draw Those Lines
- Support Lines: Find a string of lows where price dips and rebounds. Slap a horizontal line across them—usually below the current price. Keep it tight; a slight angle’s fine if it fits.
- Resistance Lines: Spot a row of highs where price peaks and falls. Draw a horizontal line connecting them—usually above the current price. Clean and simple.
Test Them Out
Lines drawn? Watch how price reacts. If it keeps bouncing or stalling at your levels, you’ve got a winner. If it blasts through like nothing’s there, rethink it—charts don’t lie.
Keep Them Fresh
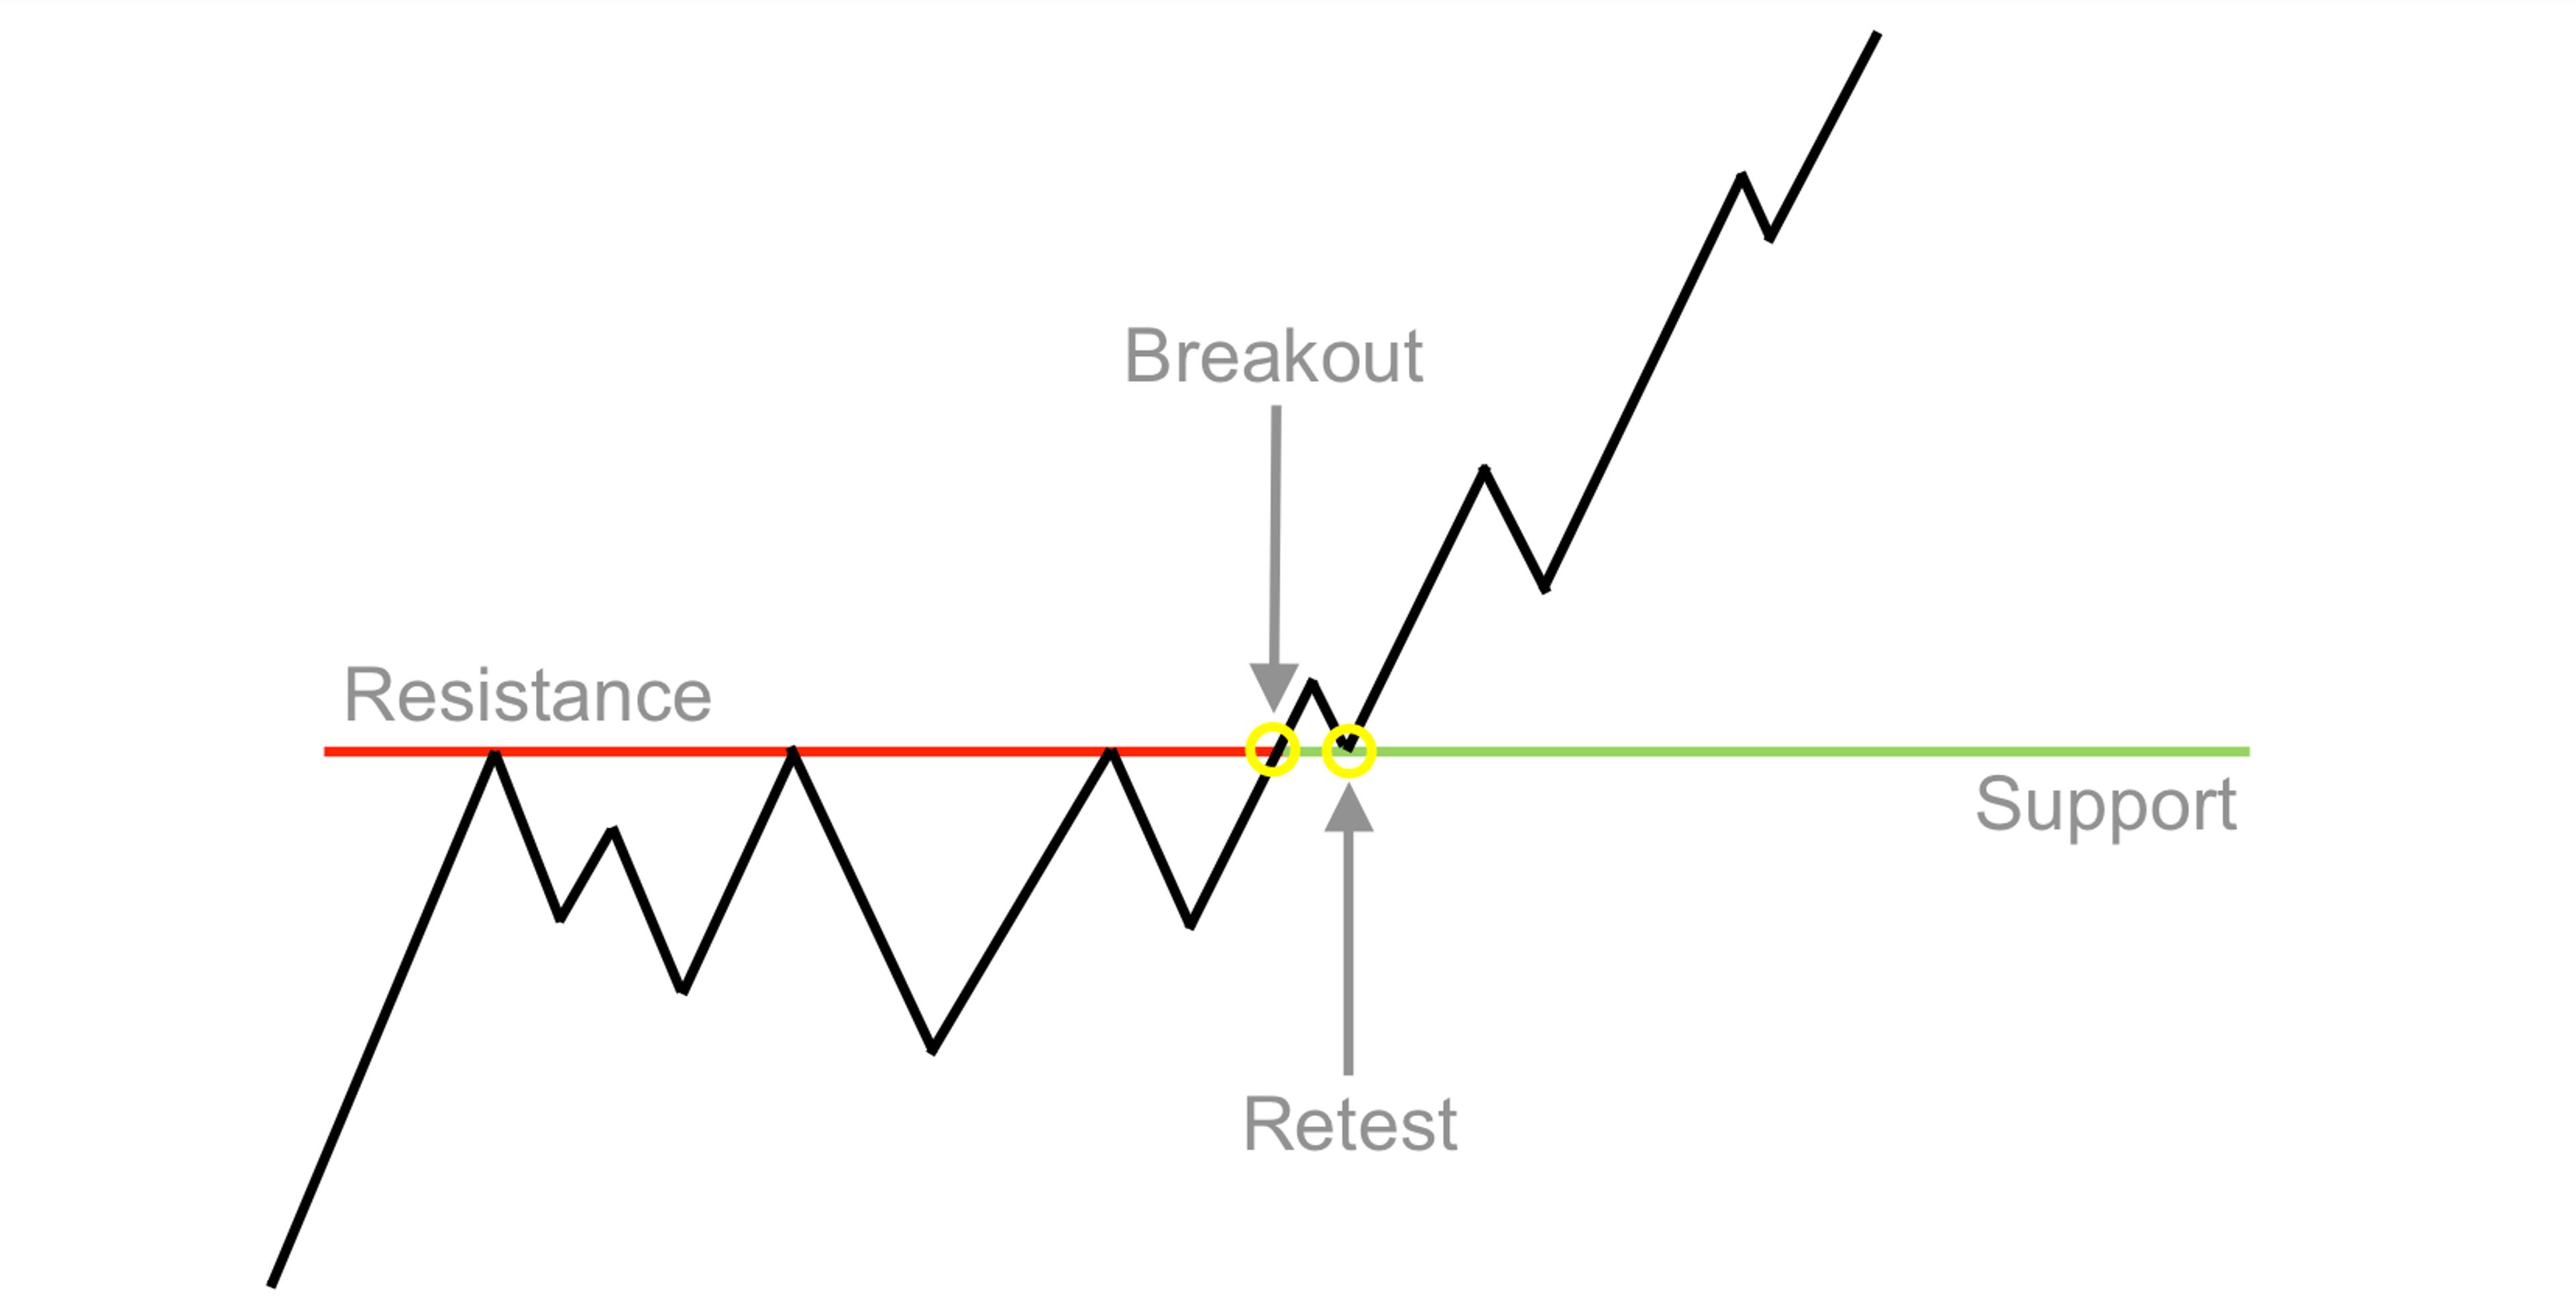
Markets move, so your lines aren’t set in stone. Price smashes resistance and keeps climbing. That old ceiling might flip to new support. Support caves in. It could turn into resistance. Stay nimble—adjust as the game changes.
Play the Levels on PRDT
Here’s how to use them:
- Breakouts: Price punches through support or resistance? That’s a signal—jump on the trend and predict the breakout direction.
- Range Trading: Stuck between levels? Predict a bounce—buy near support, sell near resistance.
- Stops and Targets: Set stop-losses just below support or above resistance. Aim for profits near the next big line.
On PRDT, where timers tick fast, these levels help you call the next move—up or down—before the clock runs out.
Don’t Screw This Up
- Don’t Force It: Draw where the price is, not where you wish it’d go. Wishful lines lose money.
- Check the Big Picture: Solo lines are cool, but pair ‘em with other tools—volume, trends, whatever—to avoid getting blindsided.
Practice ‘Til It Clicks
Drawing killer support and resistance takes reps. Keep eyeballing charts, tweaking lines, and watching how price plays. Soon, you’ll spot these levels like second nature—giving your PRDT predictions a serious boost.
Wrap It Up
Support and resistance lines are your trading GPS—basic, but clutch. Get good at drawing them, and you’ll see crypto moves clearer—whether it’s a bounce, a break, or a bust. On prdt.finance, they’re your ticket to smarter calls. Grab a chart, start sketching, and predict like you mean it.